
MCAT Score Calculator: Raw to Scaled Score Converter
By MCAT Study Planner Team • Updated 11/8/2026
Short answer: the AAMC publishes no raw to scaled conversion table. It publishes two worked examples, and the conversion table that ranks for this search contradicts one of them by three scaled points. Our MCAT score calculator is built on those two examples instead, so it returns both of them exactly.
That sounds like a small distinction. It is worth up to 16 points of total score.
Every calculator on this search presents one number with confidence. None of them shows you the arithmetic underneath it, and the two that publish a table do not agree with each other or, in one case, with the AAMC.
The 30-second answer: each section is scored 118 to 132 and the four add to a total of 472 to 528. The AAMC converts your number correct to a scaled score by equating, tailored per test form, and says the exact conversion is not constant. The only conversions it has ever printed are 35 to 37 correct “might be” 123, and 46 to 48 “might be” 128. That works out to about 2.2 correct answers per scaled point. The percentile attached to your total is not an estimate at all: a 500 is the 48th, a 510 the 79th, a 515 the 91st.
In this guide
- Use the calculator
- The AAMC does not publish a conversion table
- The two conversions the AAMC does publish
- Our table, and the one check it passes
- What the popular table does to your score
- Your percentile is not an estimate
- The questions in your section that were never scored
- What the next scaled point costs you
- Every number on one page
Use the Calculator
The converter lives at /mcat-score-calculator. Type in the number of questions you got right in each section and it returns the scaled score per section, the total, and the official percentile for both. No email, no account.
It differs from the others in four ways, and each one is explained below. It shows a range rather than a single number. It flags any section whose raw count sits outside the AAMC’s published examples. Its percentiles are the official per-point values rather than banded approximations. And it tells you what one more scaled point would cost you in correct answers.
The AAMC Does Not Publish a Conversion Table
This is the fact the whole page rests on, and it is stated plainly on the AAMC’s own scoring page, which we read on November 8, 2026.
The exact conversion of number correct to scaled scores is not constant because each conversion is tailored to the specific set of questions included on a test form.
The mechanism is equating. Several forms of the exam run in a testing year, each with different questions. The AAMC adjusts for the small differences in difficulty between them so that a 124 on one form means what a 124 means on any other. That adjustment is computed per form, after the test date, which is also why the AAMC says scaling and equating take 30 to 35 days.
So there is no master chart to look up. Two things follow. First, any site presenting a conversion chart as the official one is presenting an estimate. Second, that estimate can be checked, because the AAMC has printed two conversions of its own.
A separate point worth keeping straight: none of this is a curve. The AAMC says the exam is not graded on a curve, and your score does not depend on who tested with you. Your number correct is simply the count of questions you answered correctly, and per the AAMC, wrong answers score the same as blanks, so there is no reason to leave anything empty.
The Two Conversions the AAMC Does Publish
Buried in the same scoring page are the only two raw to scaled conversions the AAMC has put in print:
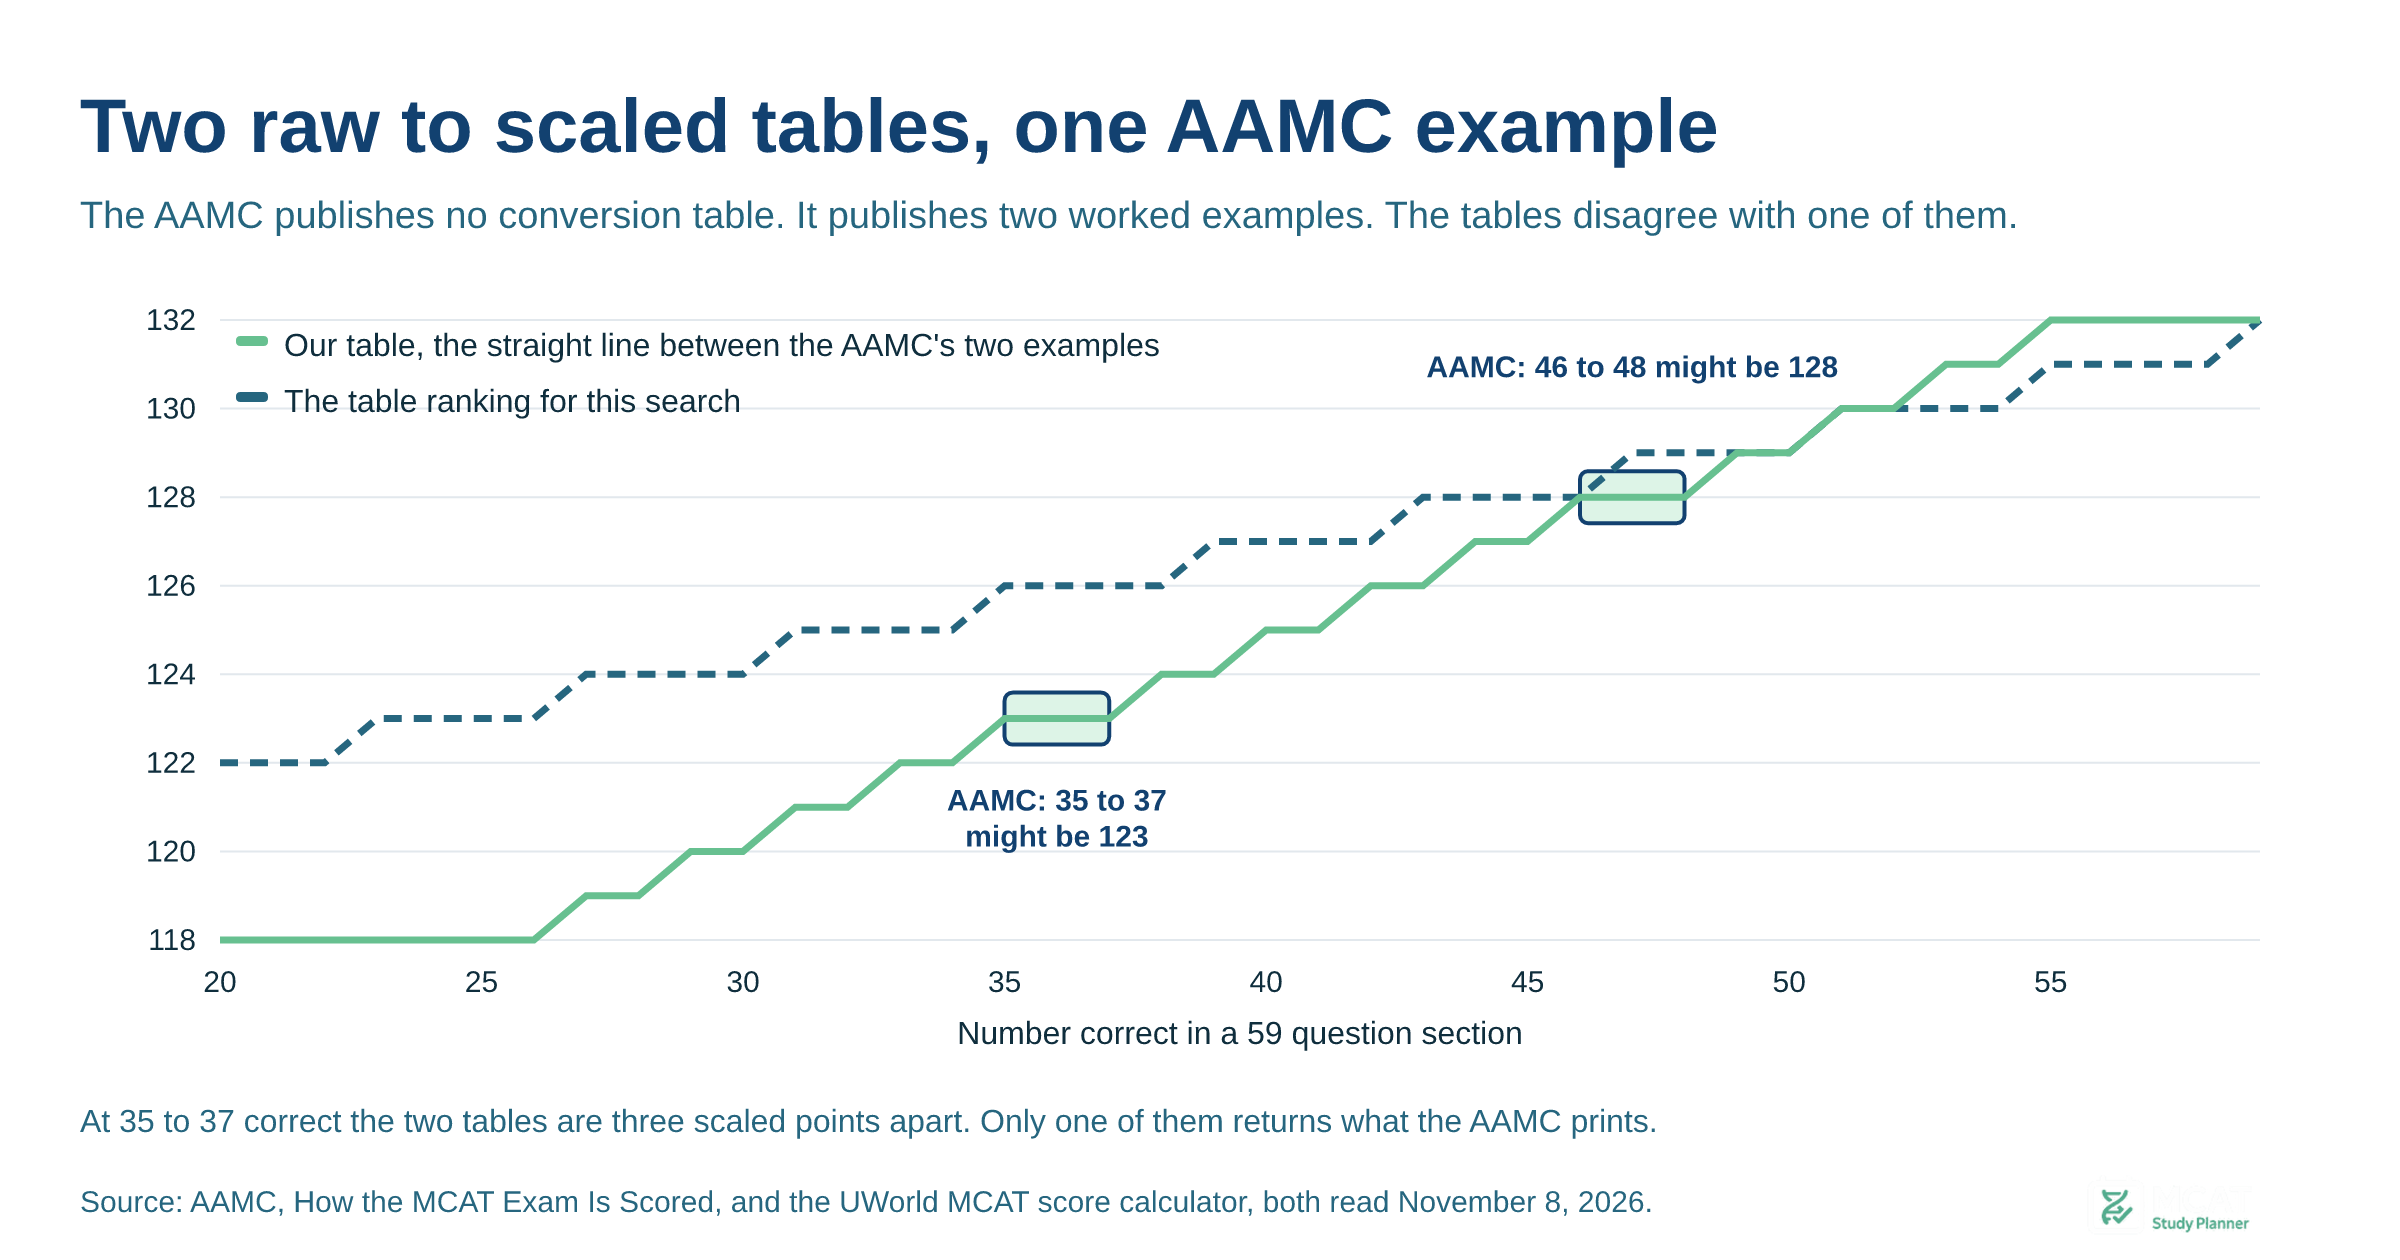
For example, if your number correct score on one of the sections is between 35 and 37, your converted score might be 123. Number correct scores ranging from 46 to 48 might have a converted score of 128.
Note the hedging. “Might be” is doing real work there, and it is consistent with the sentence about the conversion not being constant. These are illustrations, not a promise.
They are still the best anchors anyone has, because they are the only two the AAMC has given. Cross them and you get the rate: 11 more correct answers buy 5 more scaled points, which is 2.2 correct answers per scaled point. That is our arithmetic on the AAMC’s figures, and it is the number the rest of this page turns on.
Our Table, and the One Check It Passes
We drew the straight line between the AAMC’s two examples and read the table off it. For the three 59-question sections:
| Scaled score | Number correct | Scaled score | Number correct |
|---|---|---|---|
| 132 | 55 to 59 | 124 | 38 to 39 |
| 131 | 53 to 54 | 123 | 35 to 37 |
| 130 | 51 to 52 | 122 | 33 to 34 |
| 129 | 49 to 50 | 121 | 31 to 32 |
| 128 | 46 to 48 | 120 | 29 to 30 |
| 127 | 44 to 45 | 119 | 27 to 28 |
| 126 | 42 to 43 | 118 | 0 to 26 |
| 125 | 40 to 41 |
Read two rows off it: 123 is 35 to 37, and 128 is 46 to 48. Those are the AAMC’s own bands, returned exactly. That is the only check available on a conversion table, and as far as we could find on November 8, 2026, no other published table passes it.
CARS has 53 questions rather than 59, so the same line is rescaled by question count, which puts it at 1.98 correct answers per scaled point. The AAMC says “one of the sections” without naming which, so that rescaling is an assumption of ours, stated here rather than hidden.
Two honest limits. The AAMC’s examples cover number correct from 35 to 48 on a 59-question section. Inside that window our table interpolates. Outside it, the table extends the same straight line, which is a weaker claim, and the calculator marks those results as extrapolated rather than quietly returning them. And the AAMC’s sentence about per-form conversion still stands over all of it: a real form can land somewhere else.
What the Popular Table Does to Your Score
UWorld publishes a full conversion table, and it deserves credit for showing its work when most calculators show none. It also discloses that its tables “can differ from official AAMC scoring by 1 to 2 scaled points per section.”
Set it against the AAMC’s example and the difference is larger than that. UWorld’s table puts 35 to 38 correct at 126. The AAMC’s example puts 35 to 37 at 123. The underlying cause is the rate: UWorld’s table moves one scaled point every 4 correct answers, where the AAMC’s two examples imply one every 2.2. A ramp that wide has to drift.
Here is what that costs on identical raw scores, which is our arithmetic applying each table to the same four numbers:
| Chem/Phys, CARS, Bio/Biochem, Psych/Soc correct | Our table | The popular table | Difference |
|---|---|---|---|
| 30, 26, 32, 31 | 482, 6th percentile | 498, 42nd percentile | 16 points |
| 35, 32, 36, 35 | 492, 25th percentile | 504, 61st percentile | 12 points |
| 40, 36, 42, 41 | 501, 52nd percentile | 508, 74th percentile | 7 points |
| 45, 40, 46, 45 | 509, 76th percentile | 512, 84th percentile | 3 points |
| 50, 45, 51, 50 | 517, 94th percentile | 517, 94th percentile | none |
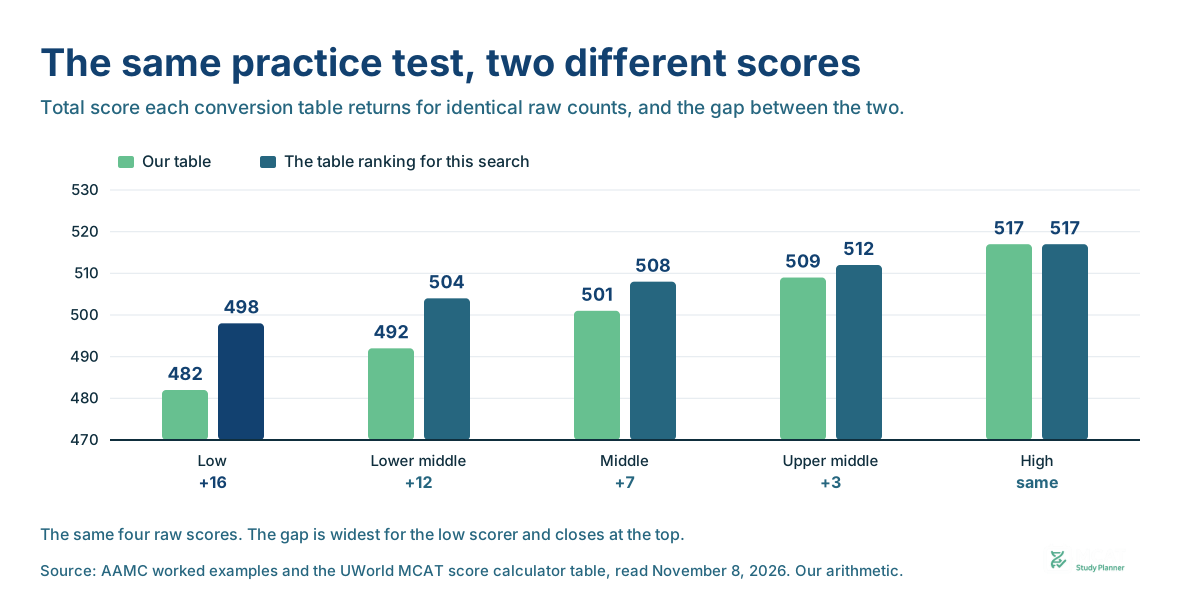
The pattern matters more than any single row. The gap is widest at the bottom and closes to nothing around 517. The students getting the most flattering number are the ones furthest from their target, which is exactly backwards for anyone trying to decide whether to move a test date.
We are not claiming our number is the true one. The AAMC has told us no true one exists in table form. We are claiming that a table which contradicts the AAMC’s own printed example by three points, at the raw score where a mid-range student actually sits, should not be read as a prediction.
Do this instead: if the practice exam was an official AAMC one, ignore every calculator including ours. The AAMC’s own exams return a scaled score computed with that form’s real conversion, which is the only exact answer available. Calculators are for third-party exams and question banks that hand you a raw count and nothing else. Every full length compared says which exams return an official scaled score.
Your Percentile Is Not an Estimate
The conversion is the uncertain half. The percentile is not, and it is the part most calculators approximate for no reason.
The AAMC publishes a percentile rank for every single score point, total and per section. The current table is in effect May 1, 2026 to April 30, 2027, and is built from 305,494 exams across the 2023, 2024 and 2025 testing years. The total score mean is 500.6 with a standard deviation of 11.2. The ranks update every May 1 from the most recent three years.
| Total score | Percentile | Total score | Percentile |
|---|---|---|---|
| 490 | 20th | 512 | 84th |
| 495 | 33rd | 515 | 91st |
| 500 | 48th | 518 | 95th |
| 505 | 64th | 520 | 97th |
| 508 | 74th | 522 | 99th |
| 510 | 79th | 525 | 100th |
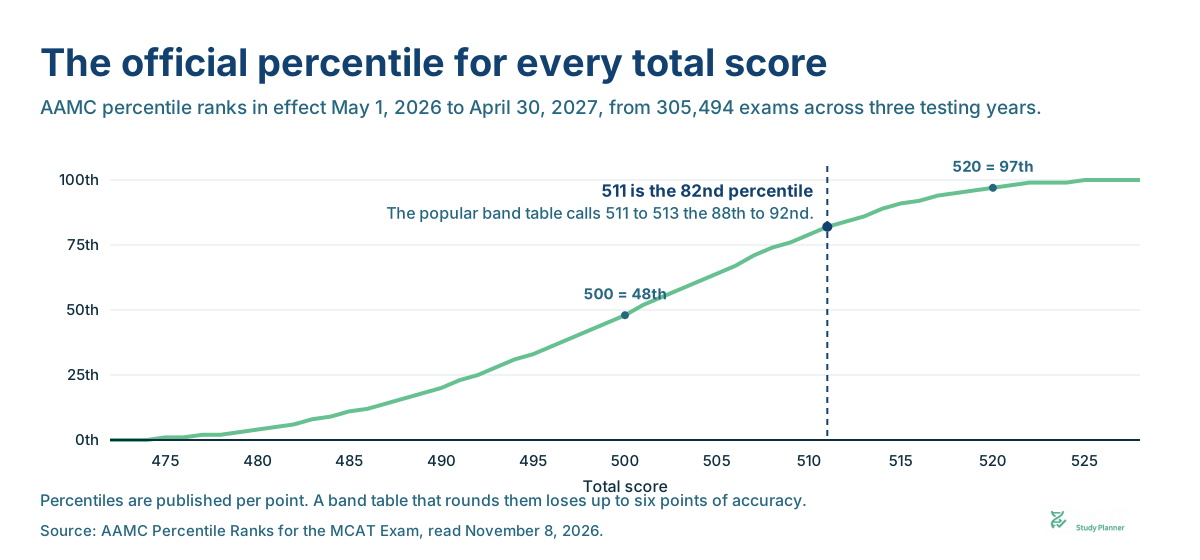
Our calculator reads these values directly. The curve is steepest between 495 and 515, where five total points move you more than 25 percentile places, which is the real argument for caring whether a conversion table is three points off.
Compare that to banding. The same UWorld page carries a total to percentile table in groups of three, and on November 8, 2026 it put 511 to 513 at the 88th to 92nd percentile. The official table in effect says 82nd to 86th. It put 505 to 507 at the 70th to 79th, where the official table says 64th to 71st. There is no reason to band a table the AAMC publishes per point.
Section percentiles differ from each other too, which is why the calculator reports all four. A 125 is the 56th percentile in Chem/Phys and the 44th in Psych/Soc. Same scaled score, twelve percentile places apart, because the sections are not equally hard to score well on.
The Questions in Your Section That Were Never Scored
One more thing no calculator mentions, and it is on the AAMC’s own section pages. Each test form carries unscored field-test questions, and you are never told which ones they are.
So when you type 45 out of 59 into any calculator, the 59 is not the number the AAMC scored. Some of those questions were being tried out for future forms. Your real denominator is smaller and unknown, your real numerator is smaller and unknown, and no table can correct for it.
This is not a reason to distrust practice scores. It is a reason to read them as a band rather than a number, which is why our calculator reports a range and the AAMC itself reports confidence bands on real score reports. If you are using practice tests to make a decision, the four-hour full-length review system is a better use of the result than the score on the front of it.
What the Next Scaled Point Costs You
Here is the one output we have not seen anywhere else, and it falls straight out of the rate.
| Section | Questions | Correct answers per scaled point |
|---|---|---|
| Chem/Phys | 59 | 2.2 |
| CARS | 53 | 1.98 |
| Bio/Biochem | 59 | 2.2 |
| Psych/Soc | 59 | 2.2 |
Two or three more right answers in a section is one more point of total score. Ten points of total score is somewhere around 22 more correct answers across the whole exam, which is a different kind of target from “I need to go from 501 to 511.”
The calculator computes this per section from where you actually are, because the cost is not even: if you sit at 41 correct you are one answer from the next band, and if you sit at 40 you are two away. Spend the next block where the next point is cheapest, and check the section question counts and timing so the practice you add matches the section you are buying points in.
Turning that into weeks is the part a score has no opinion on. Once you know the gap and which section it lives in, build your MCAT schedule around the time you actually have before your test date, and how many hours to study for the MCAT covers what that budget realistically looks like.
Every Number on One Page
| Thing | Value | Where it comes from |
|---|---|---|
| Section score range | 118 to 132, midpoint 125 | AAMC |
| Total score range | 472 to 528, midpoint 500 | AAMC |
| Questions per section | 59, 53, 59, 59, so 230 in total | AAMC |
| Wrong answers | Scored the same as blanks, no guessing penalty | AAMC |
| Published conversions | 35 to 37 might be 123; 46 to 48 might be 128 | AAMC, both illustrative |
| Is there an official table? | No. The conversion is tailored per test form | AAMC |
| Correct answers per scaled point | 2.2, or 1.98 in CARS | Our arithmetic on the two AAMC examples |
| Percentile table in effect | May 1, 2026 to April 30, 2027 | AAMC |
| Exams behind it | 305,494, across 2023, 2024 and 2025 | AAMC |
| Total mean and spread | 500.6, standard deviation 11.2 | AAMC |
| Unscored questions | Every form carries field-test questions, unidentified | AAMC |
Everything in the left two columns was read off AAMC pages on November 8, 2026, except the two rows marked as ours. If you are deciding what to do with the number the calculator gives you, start from which diagnostic test to take and what it predicts, then put the remaining weeks in order with the free MCAT study schedule generator.
Written by
MCAT Study Planner Team
Last updated 11/8/2026